PredictiveGrid Benchmarks#
There are many time series databases on the market at the moment and they each have their own strengths and weaknesses. Some of the differences are qualitative or can be quantified without an experiment for example “this database can scale out to a cluster” or “this database supports query X”. Others need experiments run on controlled hardware in order to quantify the differences.
Using the benchmarking codebase, we evaluate a number of scenarios to model real world performance. Below you will find the results of our most recent round of benchmarking.
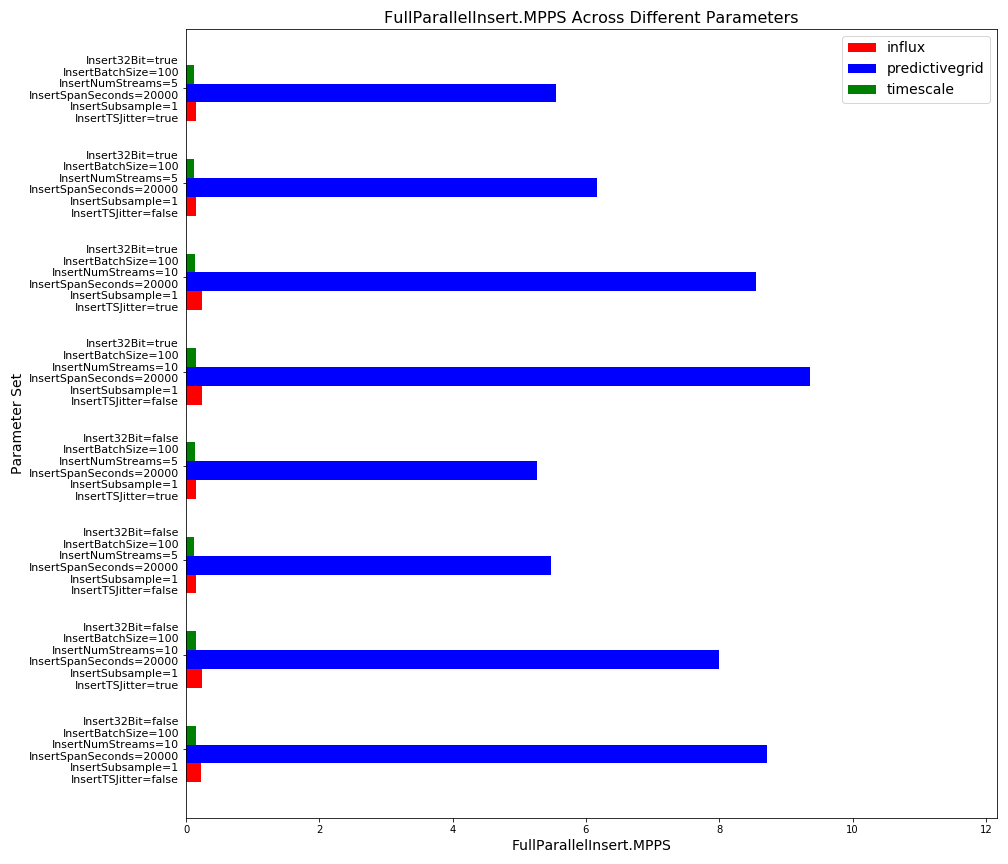
Parallel Inserts#
In the below plot, FullParallelInsert.MPPS (shown along the x axis) is compared across the databases: influx, predictivegrid, and timescale. The parameters: SequentialReadParallelNum, InsertNumStreams, InsertSpanSeconds, Insert32Bit, InsertSubsample, InsertTSJitter, and InsertBatchSize were controlled for and are given along the y axis.
Insert#
In the below plot, Insert.MPPS (shown along the x axis) is compared across the databases: influx, predictivegrid, and timescale. The parameters: SequentialReadParallelNum, InsertNumStreams, InsertSpanSeconds, Insert32Bit, InsertSubsample, InsertTSJitter, and InsertBatchSize were controlled for and are given along the y axis.

Full Parallel Sequential Read#
In the below plot, FullParallelSequentialRead.MPPS (shown along the x axis) is compared across the databases: influx, predictivegrid, and timescale. The parameters: SequentialReadParallelNum, InsertNumStreams, InsertSpanSeconds, Insert32Bit, InsertSubsample, InsertTSJitter, and InsertBatchSize were controlled for and are given along the y axis.

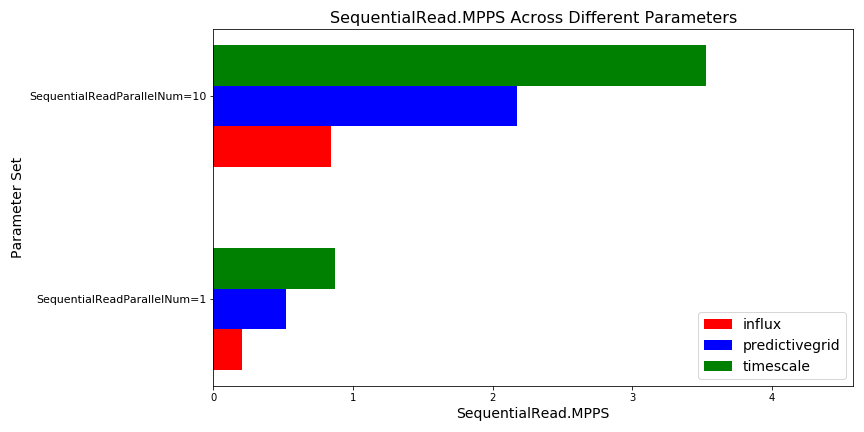
Sequential Read#
In the below plot, SequentialRead.MPPS (shown along the x axis) is compared across the databases: influx, predictivegrid, and timescale. The parameters: SequentialReadParallelNum, InsertNumStreams, InsertSpanSeconds, Insert32Bit, InsertSubsample, InsertTSJitter, and InsertBatchSize were controlled for and are given along the y axis.
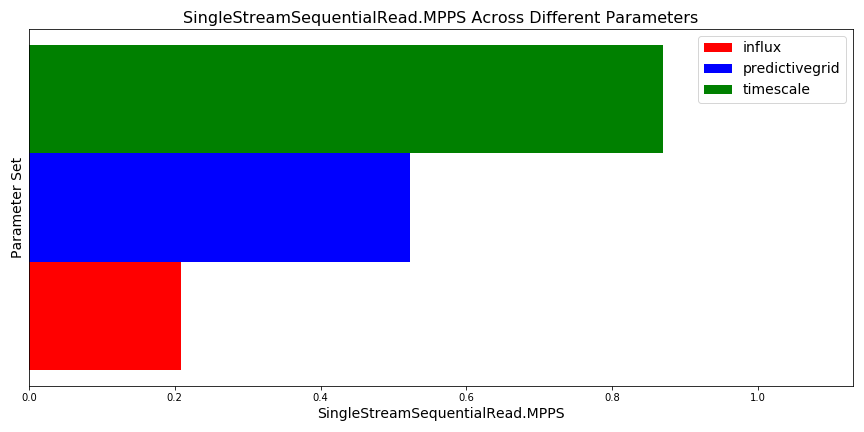
Single Stream Sequential Read#
In the below plot, SingleStreamSequentialRead.MPPS (shown along the x axis) is compared across the databases: influx, predictivegrid, and timescale. The parameters: SequentialReadParallelNum, InsertNumStreams, InsertSpanSeconds, Insert32Bit, InsertSubsample, InsertTSJitter, and InsertBatchSize were controlled for and are given along the y axis.
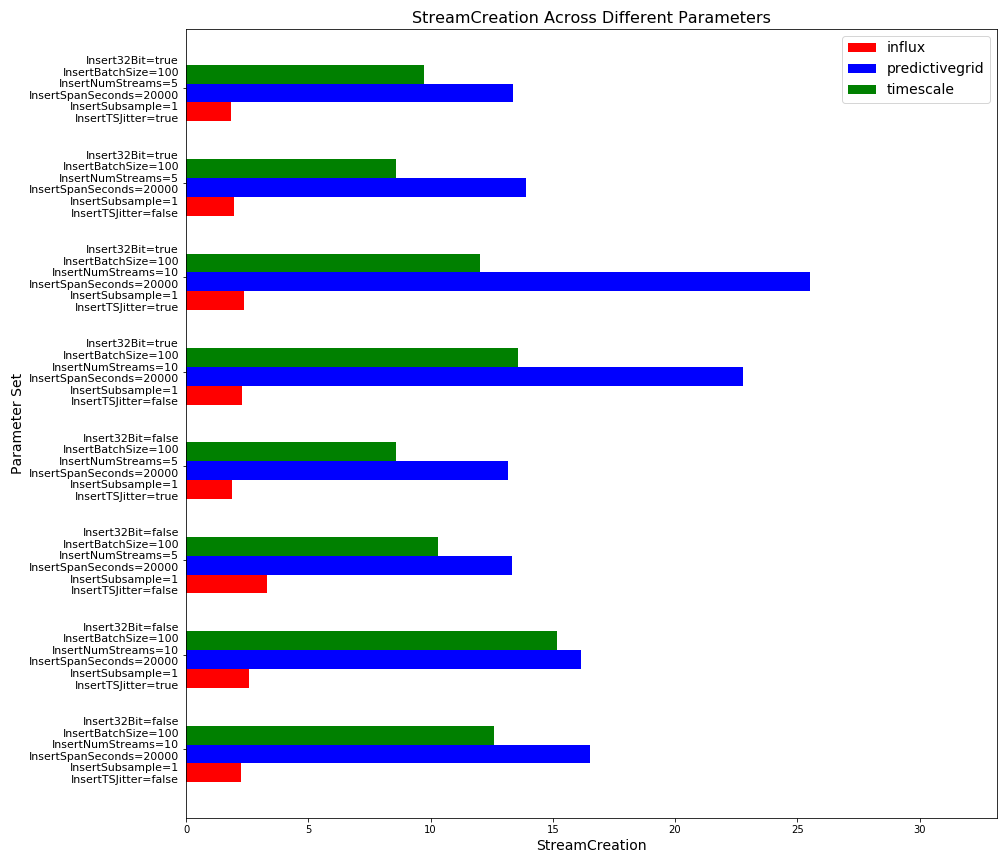
Stream Creation#
In the below plot, StreamCreation (shown along the x axis) is compared across the databases: influx, predictivegrid, and timescale. The parameters: SequentialReadParallelNum, InsertNumStreams, InsertSpanSeconds, Insert32Bit, InsertSubsample, InsertTSJitter, and InsertBatchSize were controlled for and are given along the y axis.
Conclusion#
These results highlight a few interesting points:
We need to use a larger dataset to ensure that queries don’t get served from caches (otherwise this is not representative of the performance you would expect with large datasets).
We may need to invalidate caches between insert and query
We need to do more testing of different types of workloads (instead of just sequential)
We need to add more databases (such as InfluxDB 2.0 Alpha)