Sensor Data: PMUs#
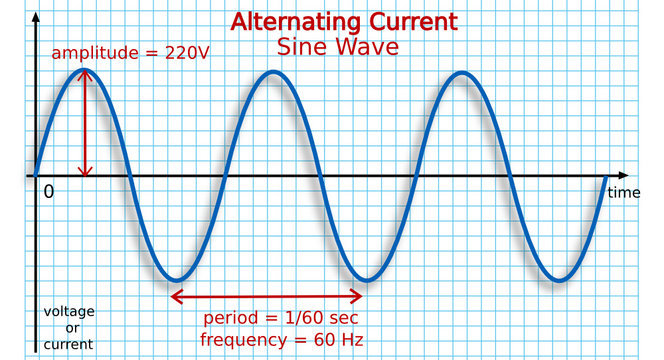
Synchrophasor technology is used to understand wide area grid health. First used in the early 2000s, synchrophasors vastly improved our ability to monitor electricity flowing throughout the grid. The AC electricity that flows across the grid can be represented with a sine wave (sinusoid) that does its best to represent an analogue signal, similarly to the way a microphone records an analogue sound and represents it with a digital approximation. The synchrophasor does this by doing the best it can with the data available via fitting a line to the data, in this case called a called a sinusoid approximation.
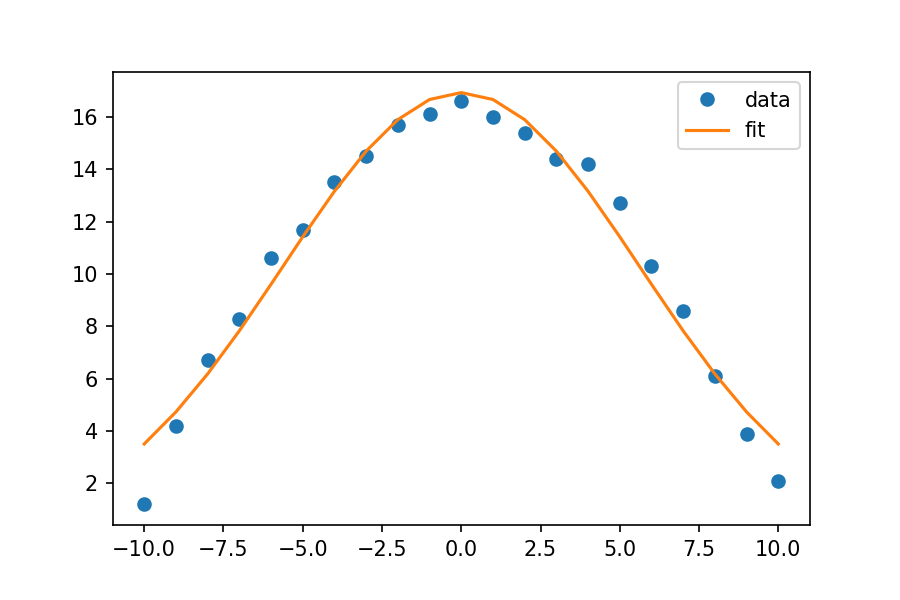
Below we can see a general example of fitting a line to data such that when we measure the distances between the line of best fit and the actual data points, this error is minimized as much as possible. In layman’s terms, we are doing our best to minimize the distance between the line and the data points. See below how the general line is “fit” pretty close to the data? Judging by the example below, since the fit is strong we may use this model to infer what the data would like in the spaces between the dots.
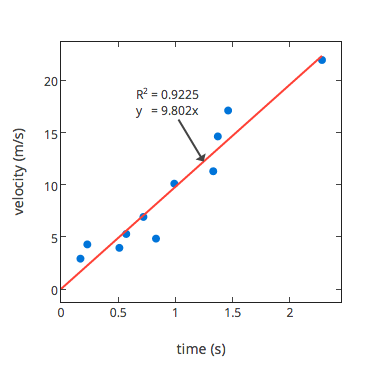
This example below may make the concept easier to understand. We can definitely see a linear trend in this example below, since Y increases proportionally to X’s increase definitely increases. The only way to capture this trend succinctly is with a linear equation (one might think back to Algebra, y = mx + b). By creating the line that minimizes the overall distance between the line and the actual data points, we can create a useable general equation for modeling the pattern within the data.
This “approximation” increases with accuracy as we can include more and more data points, which is why synchrophasor technology is so powerful when compared to SCADA– it simply measures significantly more data points.
Why are synchrophasors superior to SCADA?
Synchrophasor technology vastly improves our understanding of grid conditions since they offer significantly higher resolution than SCADA measurements. When SCADA is used to monitor a system, we are receiving data about the health of the system every 2 to 10 seconds. This speed is relatively fast and allows us to have a general understanding of grid health, however, our understanding is greatly improved with synchrophasors as they take measurements 60 times per second. This significantly faster measurement speed enables dozens of new use cases that were simply impossible with SCADA.
Synchrophasor technology is just now gaining in popularity. Today, there are over 1700 synchrophasors deployed across the United States. As these sensors collect more and more data, the challenge becomes storing the data and accessing it effectively. Using rough calculations taken from [Novel Applications for Phasor Measurement Units and Synchrophasor Data], this data streaming from 1700 sensors would fill a standard iPhone with 64 Gb of storage in just 146 minutes. Luckily, data platforms like PingThings’ PredictiveGrid allow utilities to effectively store, stream, and run advanced algorithms, even when working with this massive amount of data.